Tamanho populacional
/i.s3.glbimg.com/v1/AUTH_59edd422c0c84a879bd37670ae4f538a/internal_photos/bs/2021/B/K/EhNO4WRGW2A98SpyAKsw/dsc5845.jpg)
Parâmetros básicos
N = Tamanho da População
N0 = Tamanho da População Inicial
Nt = Tamanho da População no tempo T
A população de jacarés cresceu de 300->500
N0 = 300
Nt = 500
Mortes?
Nascimentos?
Imigrações?
Emigrações?
A população de jacarés cresceu de 300->500
N0 = 300
Nt = 400
Mortes (D) = 100
Nascimentos (B) = 200
Imigrações (I) = 100
Emigrações (E) = 100
A população de jacarés cresceu de 300->500
N0 = 300
Nt = 400
Mortes (D) = 100
Nascimentos (B) = 100
Imigrações (I) = 300
Emigrações (E) = 100
Crescimento geométrico - Populações semélparas
tempo<-seq(1:10) populacao<-(2^seq(1,10,by=1))data<-data.frame(tempo,populacao)library(ggplot2)ggplot(data=data, aes(tempo,populacao))+geom_line(group=1)+geom_point()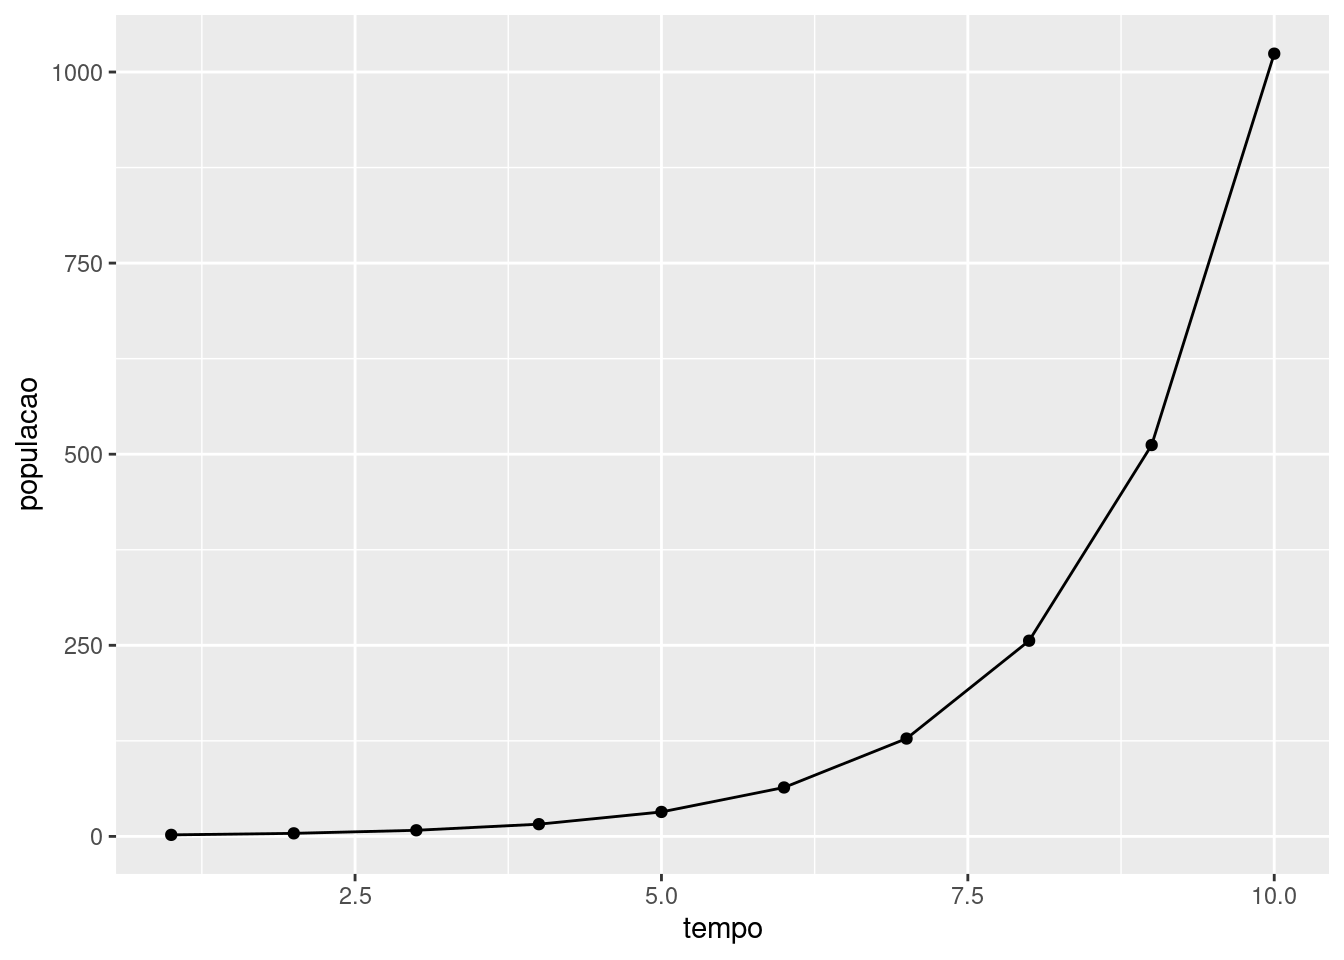
Crescimento geométrico
tempo<-seq(1:10) populacao2<-(3^seq(1,10,by=1))data2<-data.frame(tempo,populacao2)library(ggplot2)ggplot(data=data2, aes(tempo,populacao2))+geom_line(group=1)+geom_point()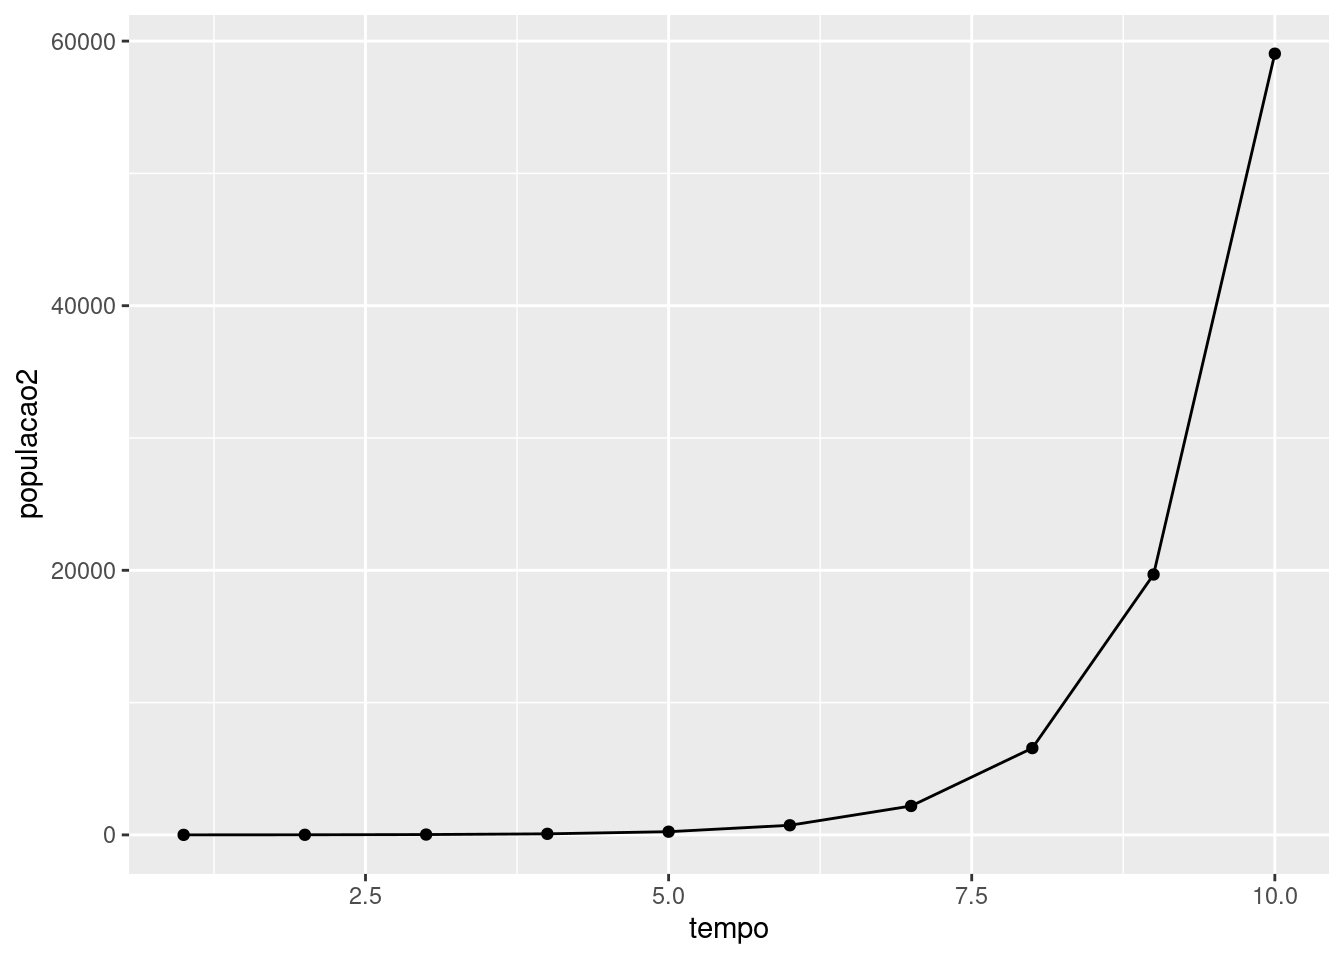
Crescimento geométrico negativo
tempo<-seq(1:10) populacao3<-(0.7^seq(1,10,by=1))*100data3<-data.frame(tempo,populacao3)library(ggplot2)ggplot(data=data3, aes(tempo,populacao3))+geom_line(group=1)+geom_point()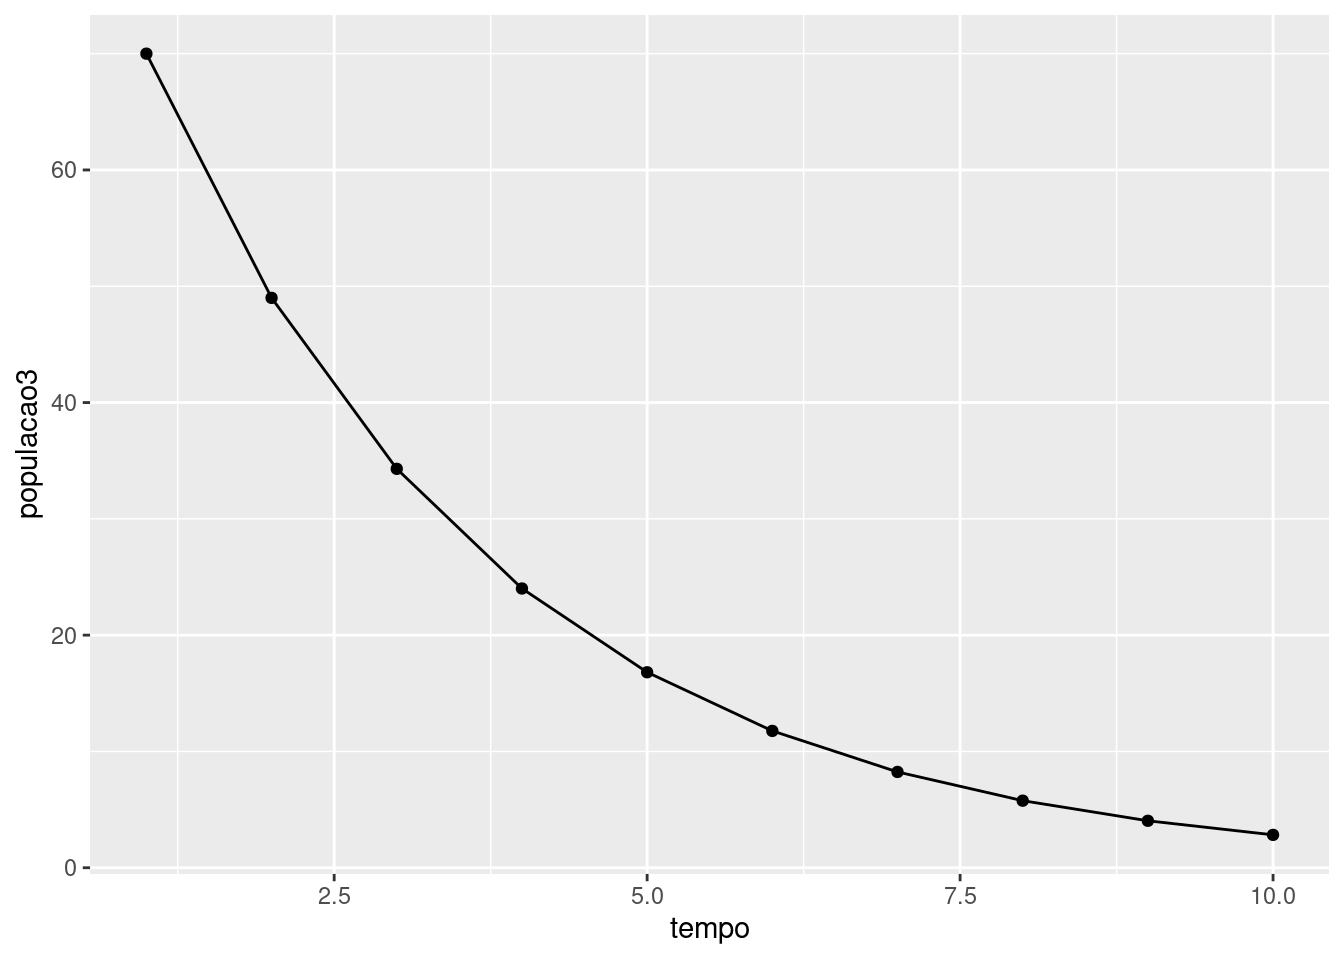
Crescimento exponencial
tempo<-seq(1:100)f<-exp(0.03*tempo)populacao4<-100*seq(100, along.with=tempo)*fdata4<-data.frame(tempo,populacao4)library(ggplot2)ggplot(data=data4, aes(tempo,populacao4))+geom_line(group=1)+geom_point()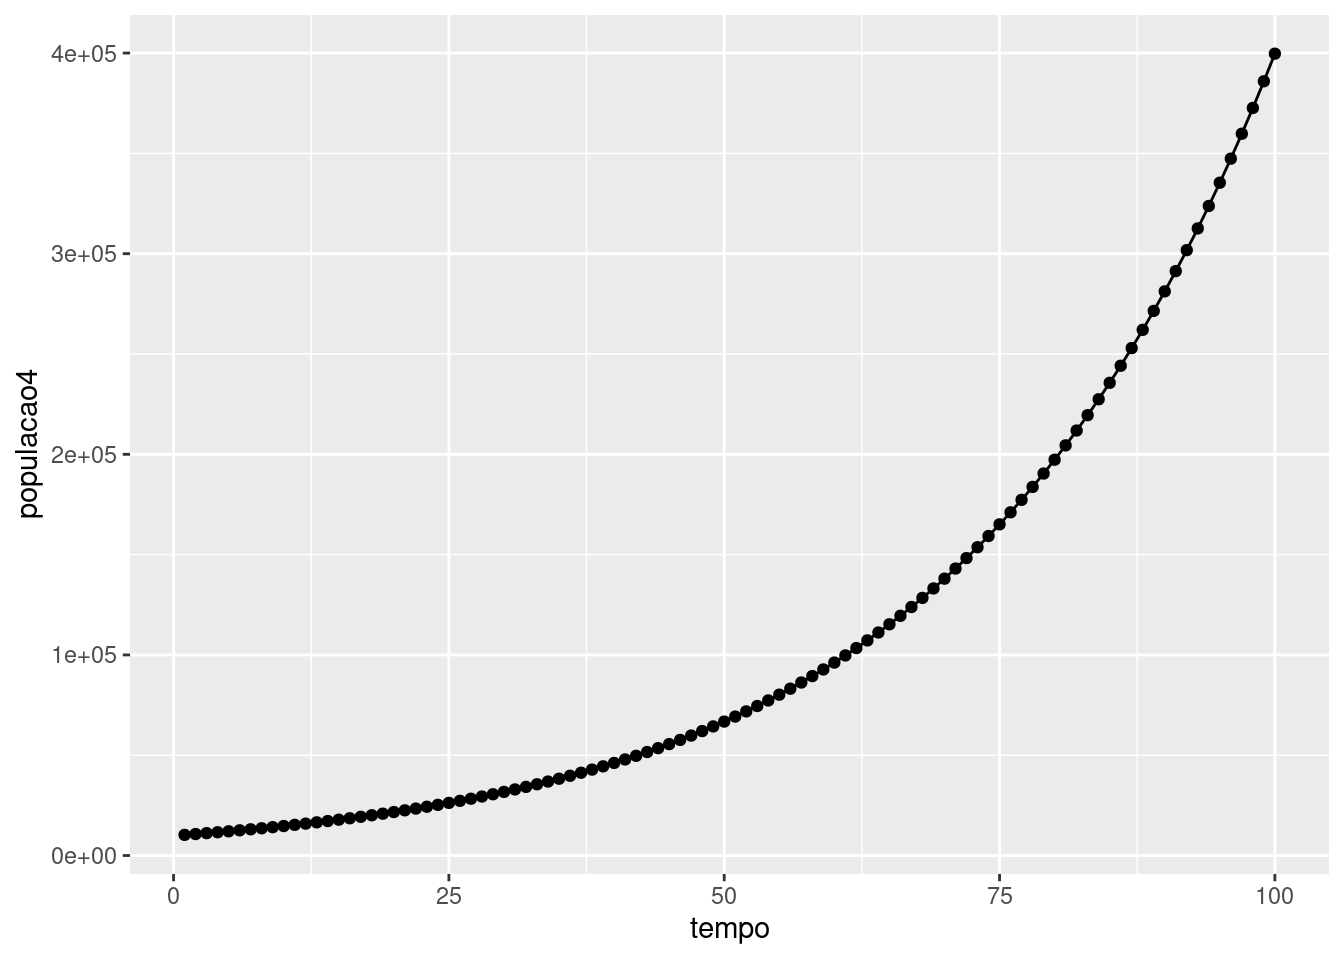
Crescimento exponencial
tempo<-seq(1:100) f<-exp(0.1*tempo)populacao4<-seq(10, along.with=tempo)*fdata4<-data.frame(tempo,populacao4)library(ggplot2)ggplot(data=data4, aes(tempo,populacao4))+geom_line(group=1)+geom_point()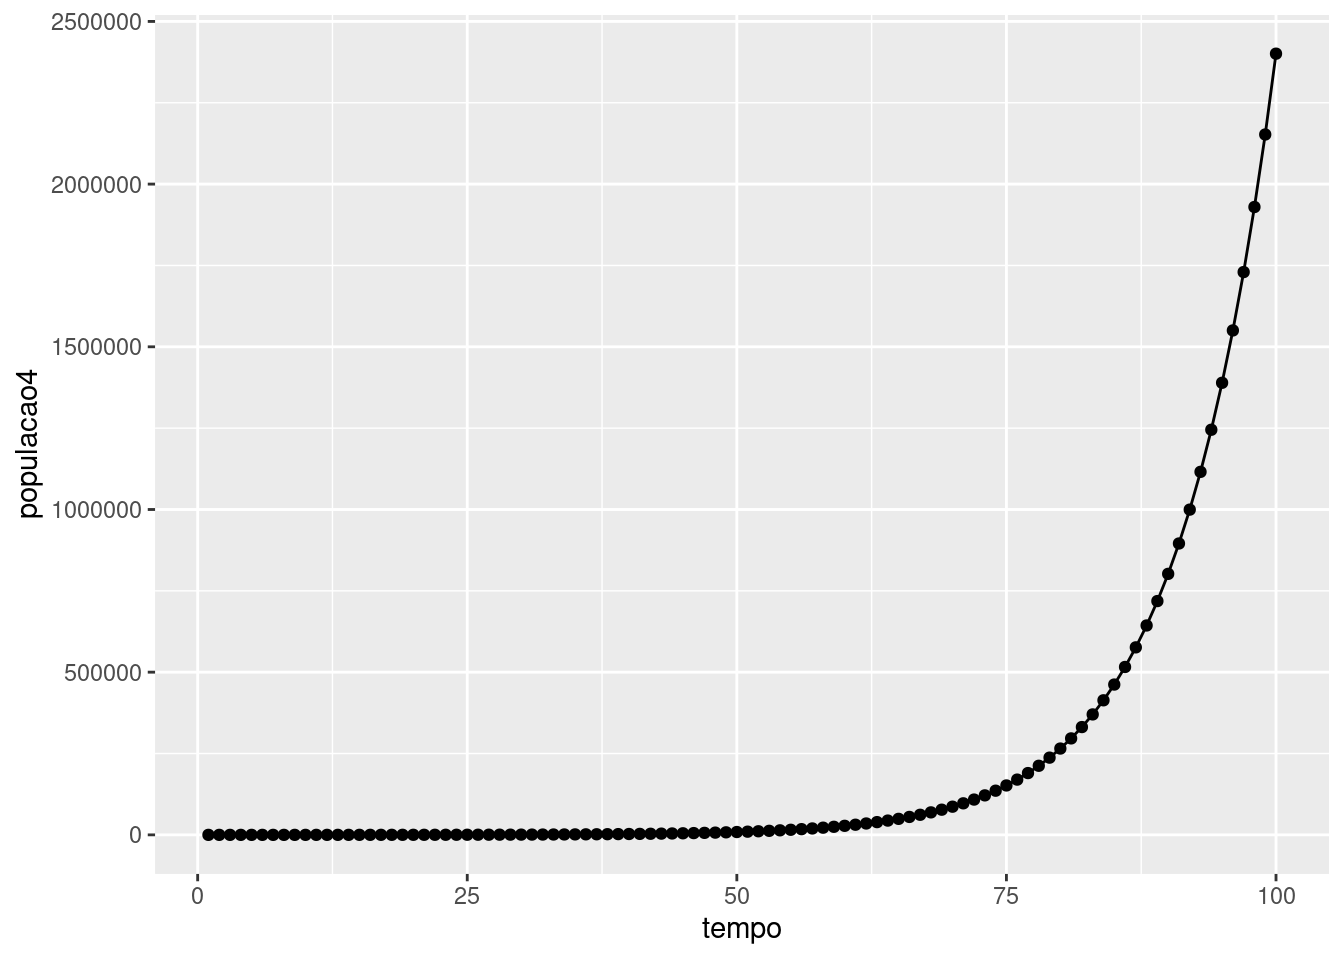
Crescimento exponencial
tempo<-seq(1:100) f<-exp(-0.1*tempo)populacao4<-seq(1000, along.with=tempo)*fdata4<-data.frame(tempo,populacao4)library(ggplot2)ggplot(data=data4, aes(tempo,populacao4))+geom_line(group=1)+geom_point()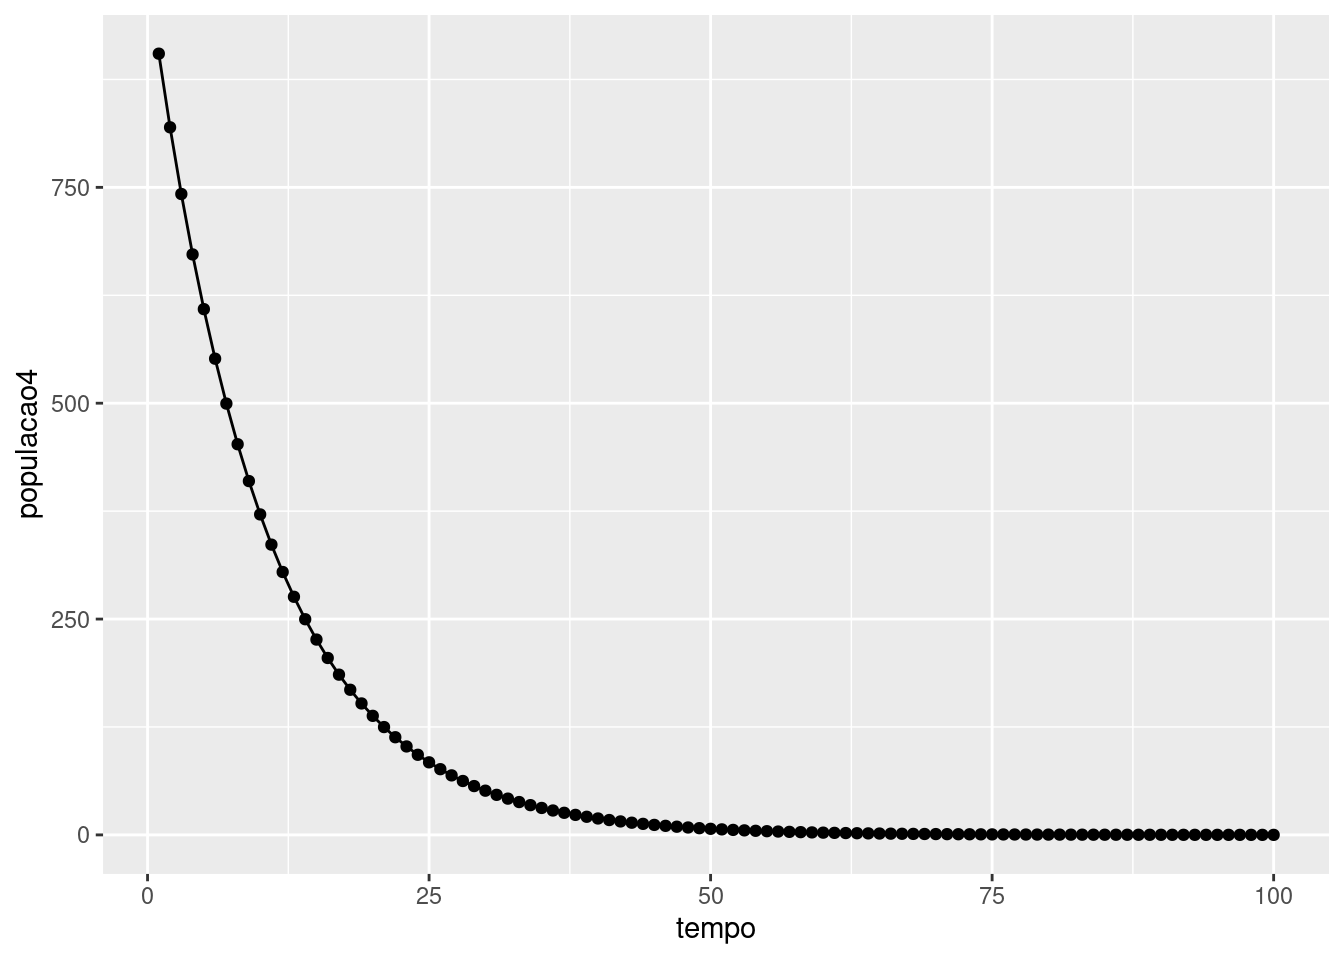
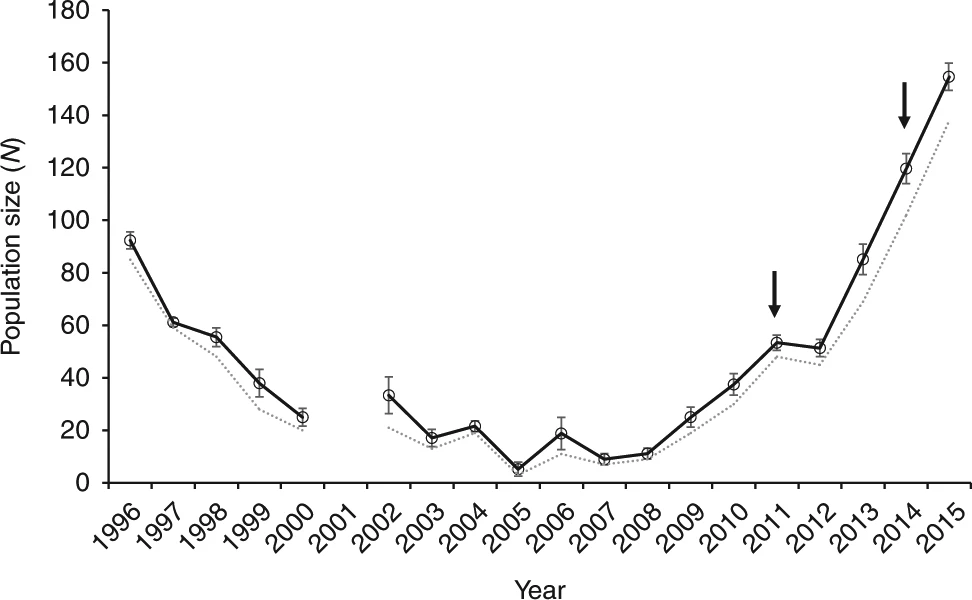
No mundo real...
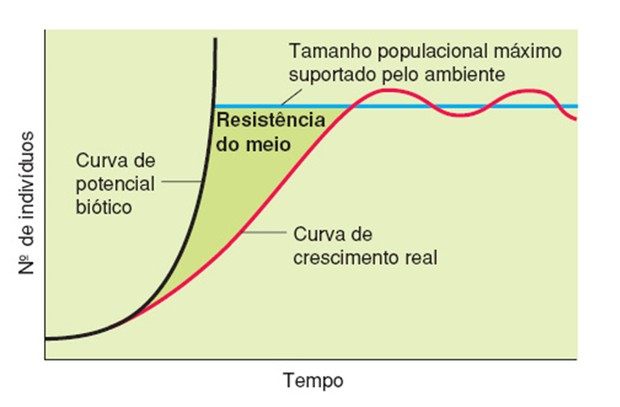
Espécies invasoras
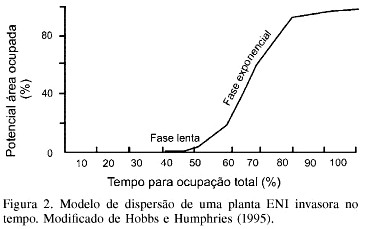 fonte: https://ve.scielo.org/scielo.php?script=sci_arttext&pid=S0378-18442007000900004