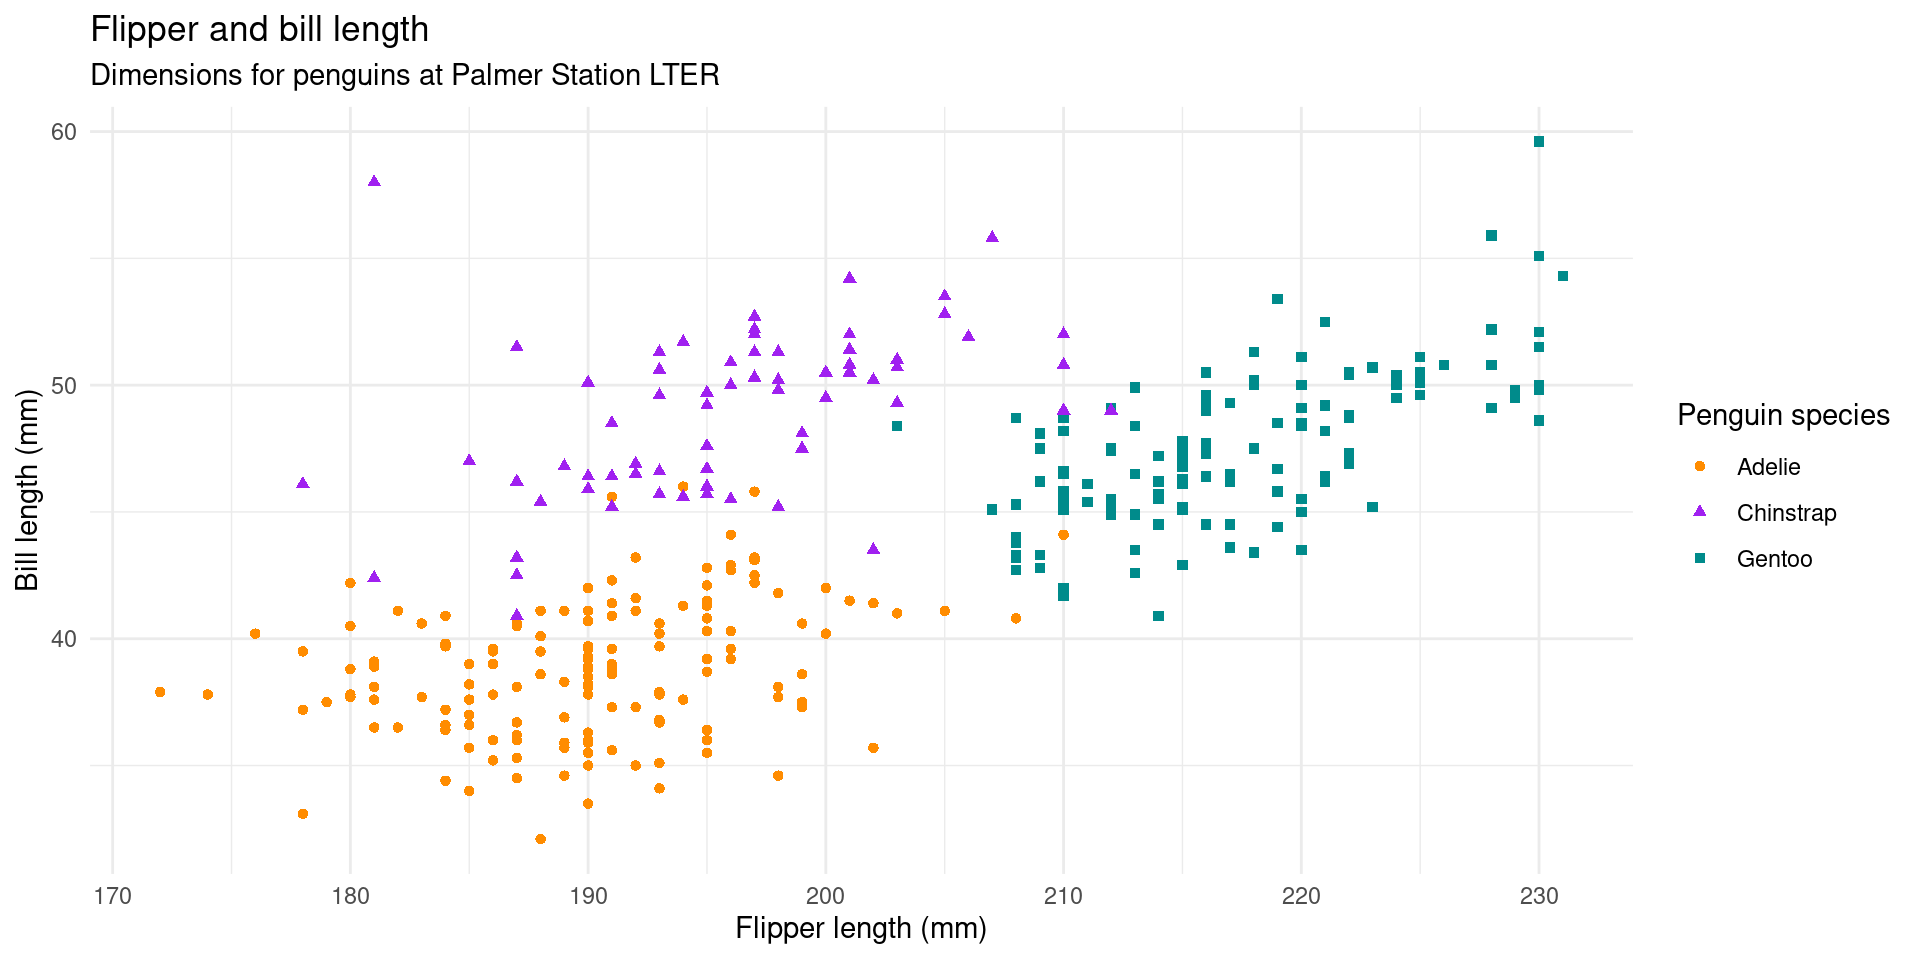
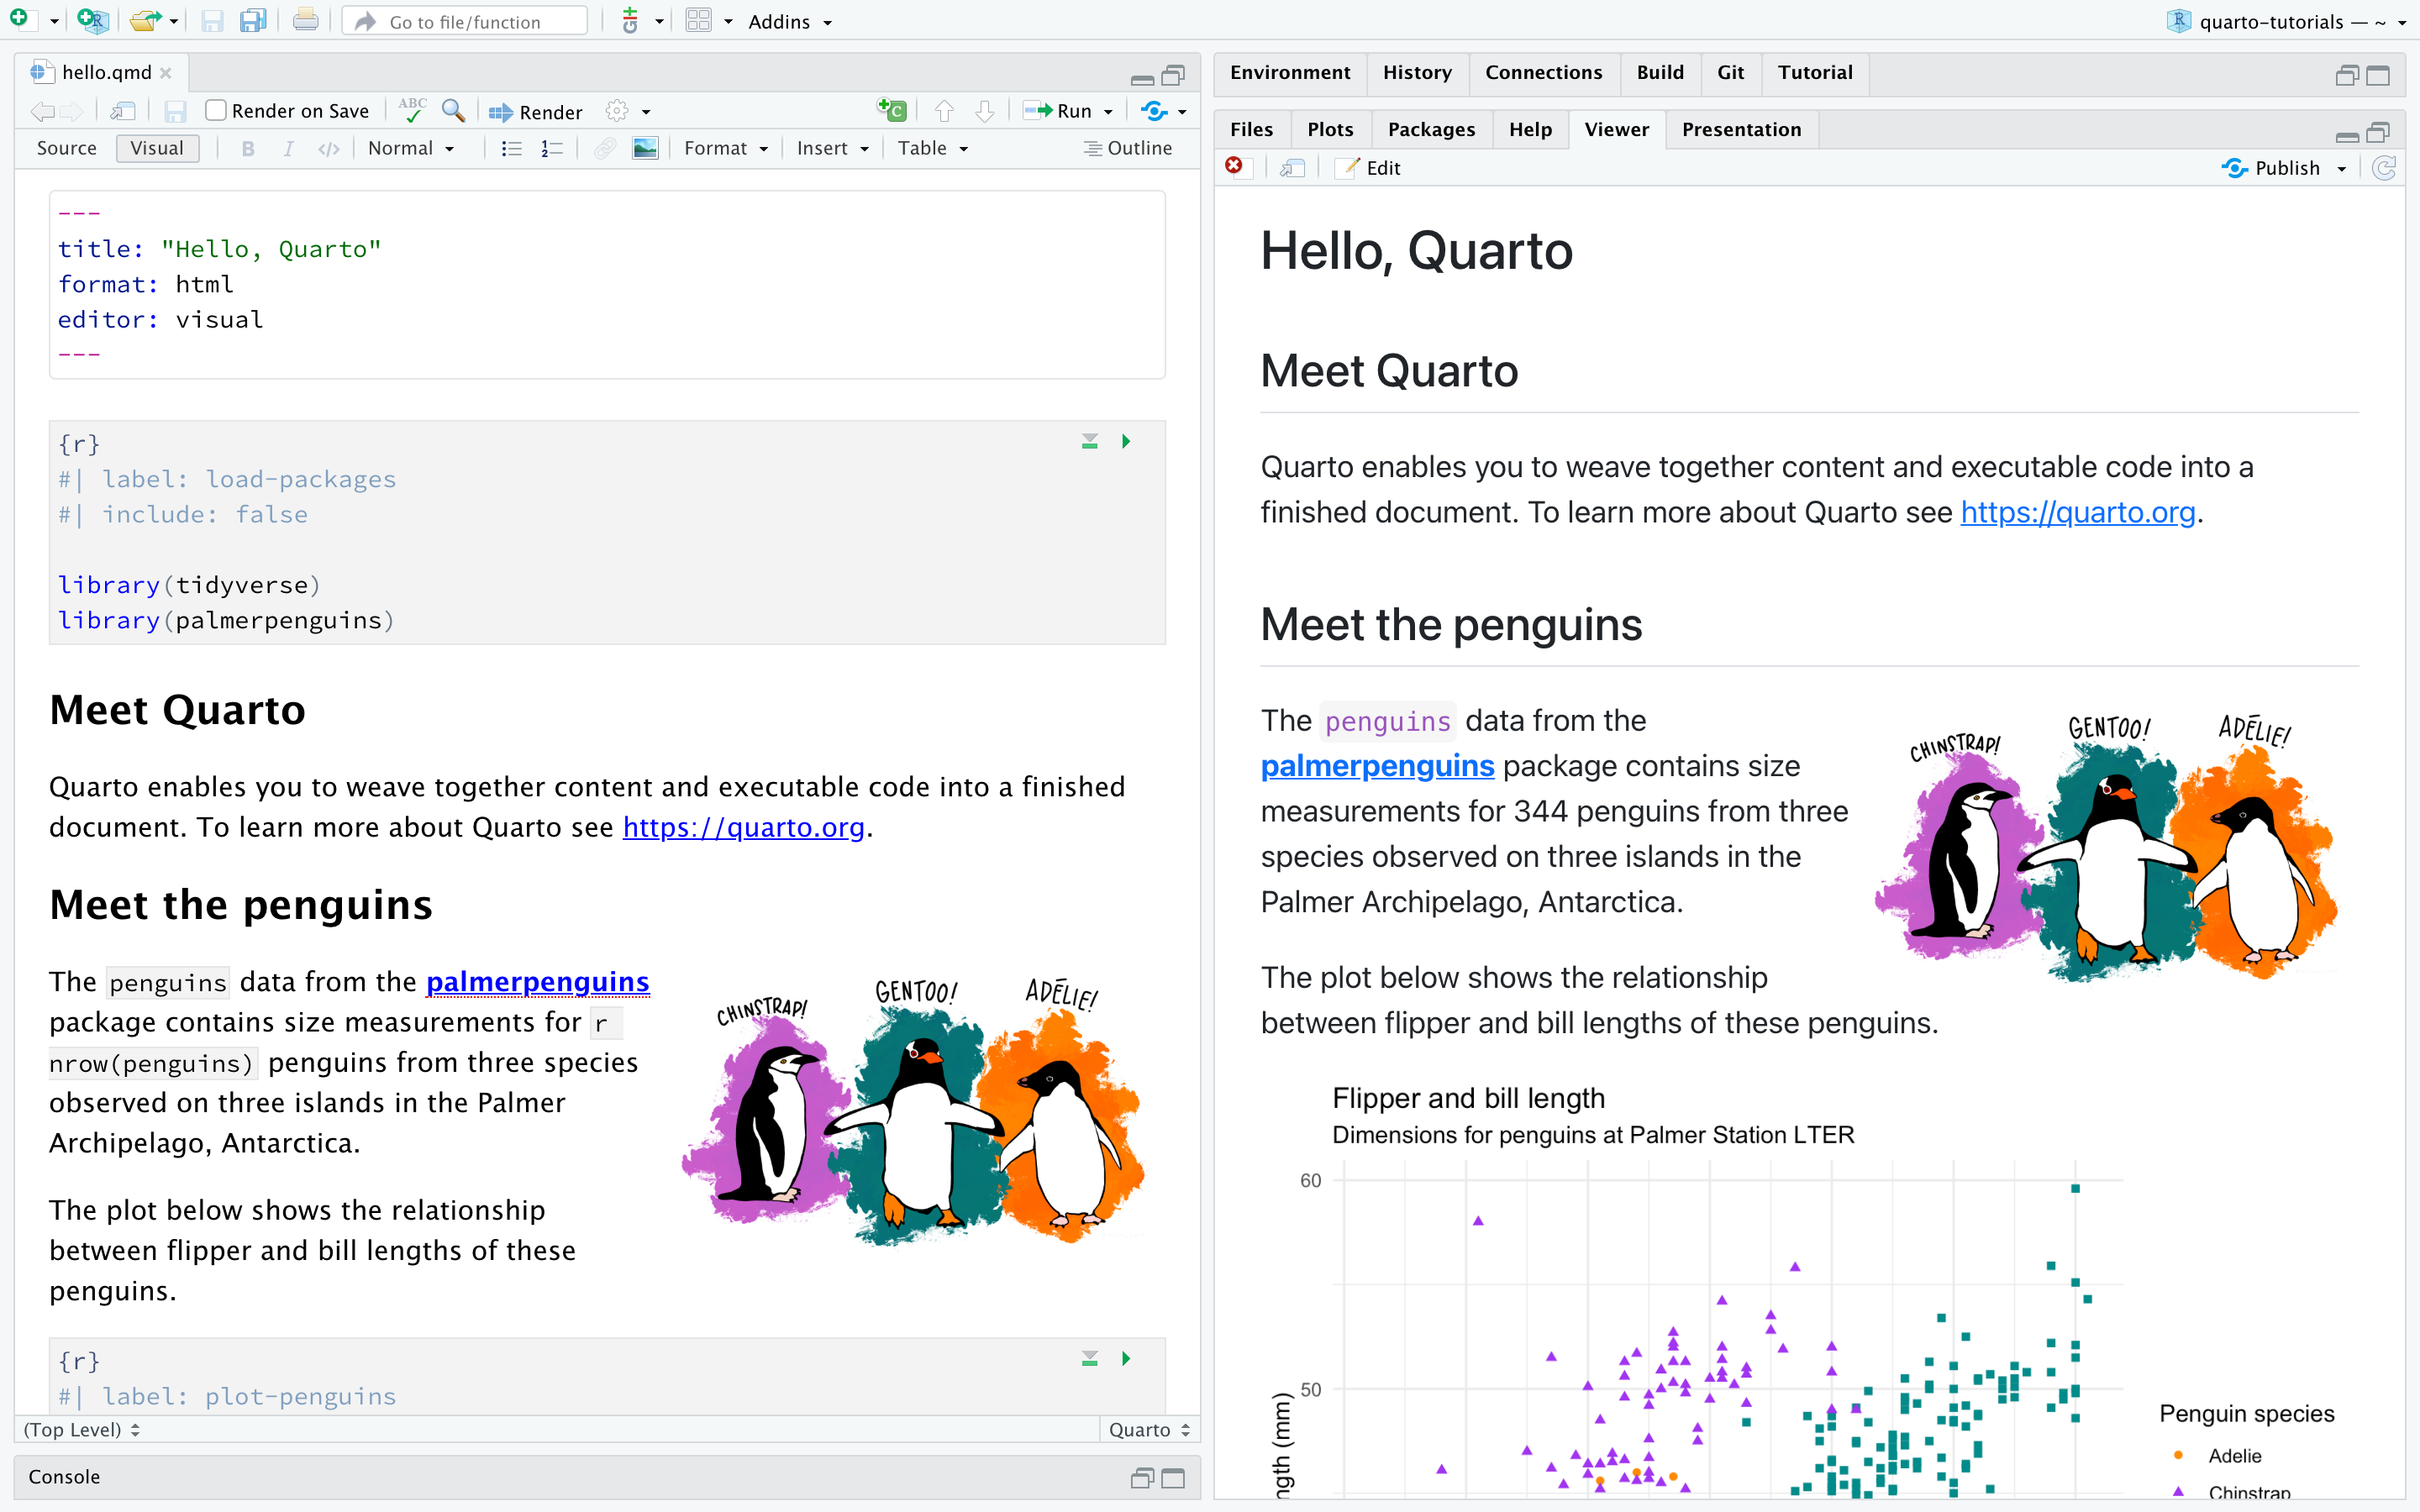
1-Introduction to RM&DA

Felipe Melo

Nottingham Trent University - UK

You should know today:

  • How this module is structured
  • How to navigate NOW page
  • What are the basic set-ups needed on your device
  • Get the dimension of the work needed

Who am I?

  • Started at NTU may 2023
  • Ecologist/Conservationist
  • Tropical Ecosystems
  • Applied Sciences

I taught RM & DA before many times

more info: My website

How this module is organized?

Two main workflows

Data Analysis

  • Cover all aspects of dealing with data
  • Mostly focused on the basics
  • Less is More in Statistics

Research Methods

  • Cover the theoretical and philosophical aspects of doing science
  • Focused on making sense of science
  • Writing and reading skills

Weekly Schedule

Sessions

Very Important

  • Pre-sessions
  • Sessions
  • Post-sessions

It may vary

Main tools

Microsoft Teams

  • Used to deliver sessions
  • Drop-in sessions
  • Group activities

NOW page

  • All Resources
  • Virtual learning tools
  • Submission of exams

Resources (… and many more online)

Finding help

We can help you with

  • Activities
  • Software troubles
  • Stats (after some proof of individual effort)

😃

What we cannot

  • Mark exams twice
  • Comment on unsubmitted Formative assessment
  • Solve exercises for you

💔

Feedback and Assessment

  • Feedback opportunities throughout the module
  • Formative assessment: multiple opportunities
  • A more ‘formal’ opportunity that will help you to understand the standard required and guidelines of a scientific journal (and make you read a paper!).

Your Workbook

Every week

Tuesdays

  • Some data analyses
  • Some research methods

Thursdays

  • Drop-in sessions
  • Tutorials

Important

But it may vary, depending on how “hard” is the week

Doing Science

Is not a gift

Effort and repetition

How to have fun with data?

ggplot(penguins, 
       aes(x = flipper_length_mm, y = bill_length_mm)) +
  geom_point(aes(color = species, shape = species)) +
  scale_color_manual(values = c("darkorange","purple","cyan4")) +
  labs(
    title = "Flipper and bill length",
    subtitle = "Dimensions for penguins at Palmer Station LTER",
    x = "Flipper length (mm)", y = "Bill length (mm)",
    color = "Penguin species", shape = "Penguin species"
  ) +
  theme_minimal()ggplot(penguins, 
       aes(x = flipper_length_mm, y = bill_length_mm)) +
  geom_point(aes(color = species, shape = species)) +
  scale_color_manual(values = c("darkorange","purple","cyan4")) +
  labs(
    title = "Flipper and bill length",
    subtitle = "Dimensions for penguins at Palmer Station LTER",
    x = "Flipper length (mm)", y = "Bill length (mm)",
    color = "Penguin species", shape = "Penguin species"
  ) +
  theme_minimal()

How to have fun with data?

Quarto Website

Your Quarto Website is your workbook for this module

Example Here

What are your expectations?

The end

1 / 25
1-Introduction to RM&DA Felipe Melo Nottingham Trent University - UK

  1. Slides

  2. Tools

  3. Close
  • 1-Introduction to RM&DA
  • You should know today:
  • Who am I?
  • How this module is organized?
  • Two main workflows
  • Weekly Schedule
  • Sessions
  • Main tools
  • Resources (… and many more online)
  • Finding help
  • Feedback and Assessment
  • Your Workbook
  • Every week
  • Doing Science
  • Slide 15
  • Slide 16
  • Slide 17
  • Slide 18
  • Slide 19
  • How to have fun with data?
  • How to have fun with data?
  • Quarto Website
  • Your Quarto Website is your workbook for this module
  • What are your expectations?
  • The end
  • f Fullscreen
  • s Speaker View
  • o Slide Overview
  • e PDF Export Mode
  • b Toggle Chalkboard
  • c Toggle Notes Canvas
  • d Download Drawings
  • ? Keyboard Help